Keeping the map true
Topologies got a new lens, guided stories, country pages and a monthly data refresh. The refresh also showed how many small ways an atlas can be wrong.

When I wrote about Topologies in June, it was as accurate as I could make it. Going back to it this autumn, the supercomputer lens still called El Capitan the world's fastest machine. TOP500 had a new number one: LineShine, in Shenzhen. Nothing in the app was broken. The world had moved and the atlas hadn't.
That's the catch with a map of infrastructure: it starts going out of date the day you publish it. So this round of work had two goals. Make the atlas easier to get into, and make it possible to keep correct. The second one turned out to be the more interesting of the two.
What's new if you open it
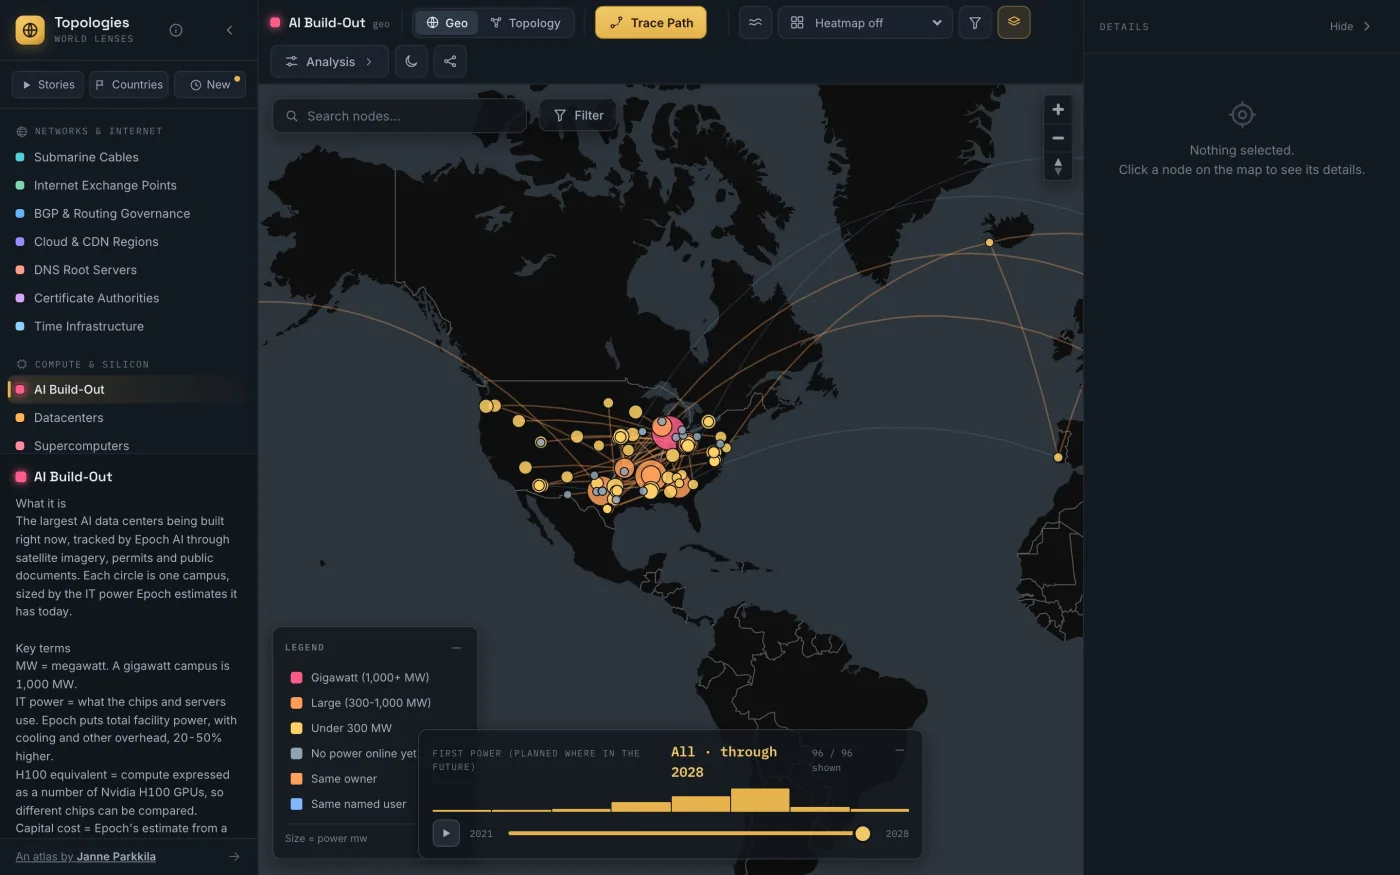
A new lens, the AI Build-Out. It maps 96 of the largest AI data centers, using Epoch AI's estimates from satellite imagery, permits and public documents. 76 have power online and 20 don't yet. That brings the atlas to 21 lenses.
 (opens full size)
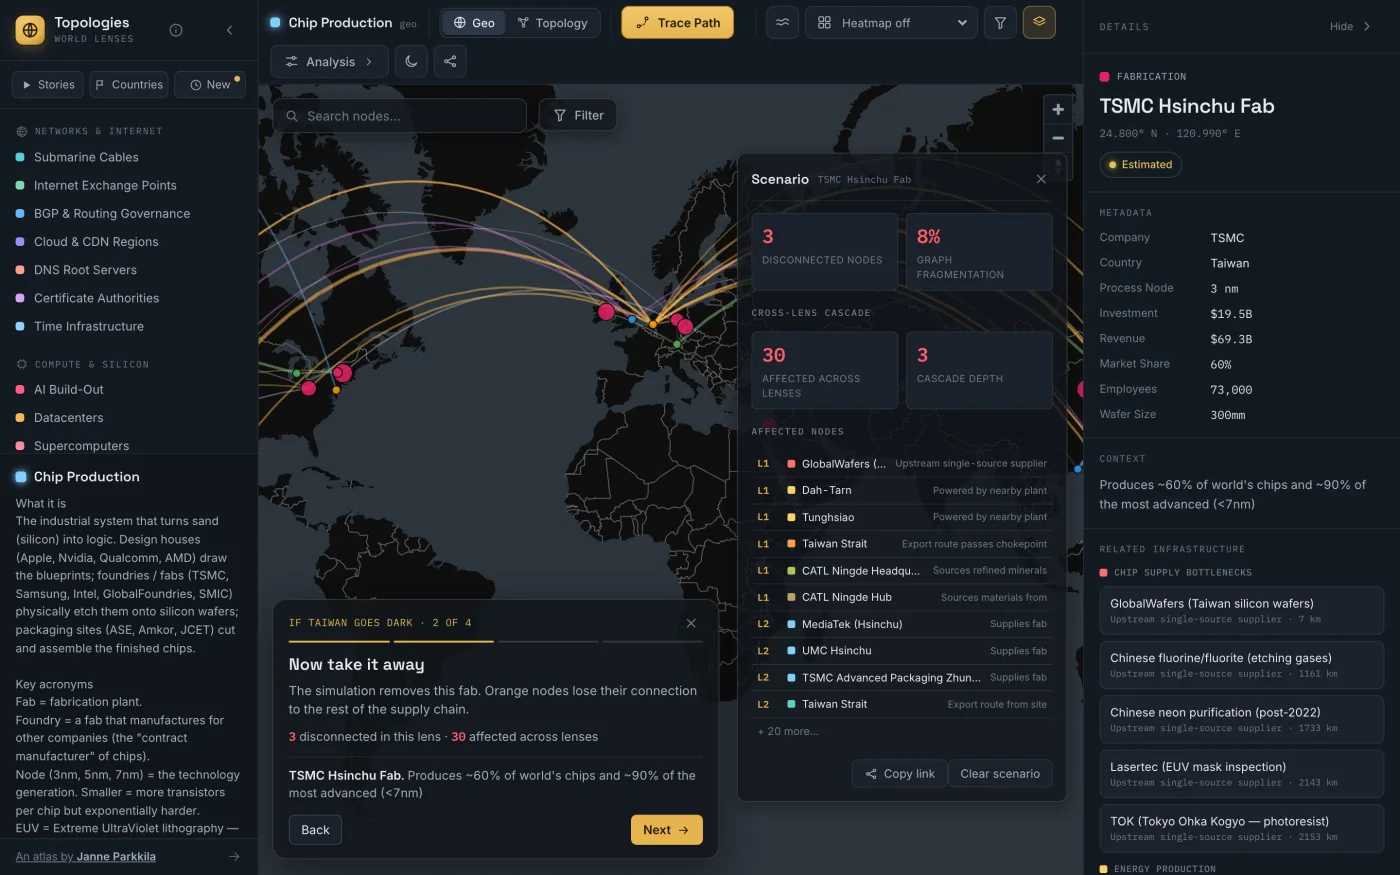
Guided stories. The old version assumed you already knew what to look for. There are now five short walks through the lenses. In If Taiwan goes dark you start at TSMC's Hsinchu fab, then remove it and watch 30 things across other lenses get flagged. The story text is only framing. Every figure comes from the data underneath, and a test fails if a story points at something that no longer exists.
 (opens full size)
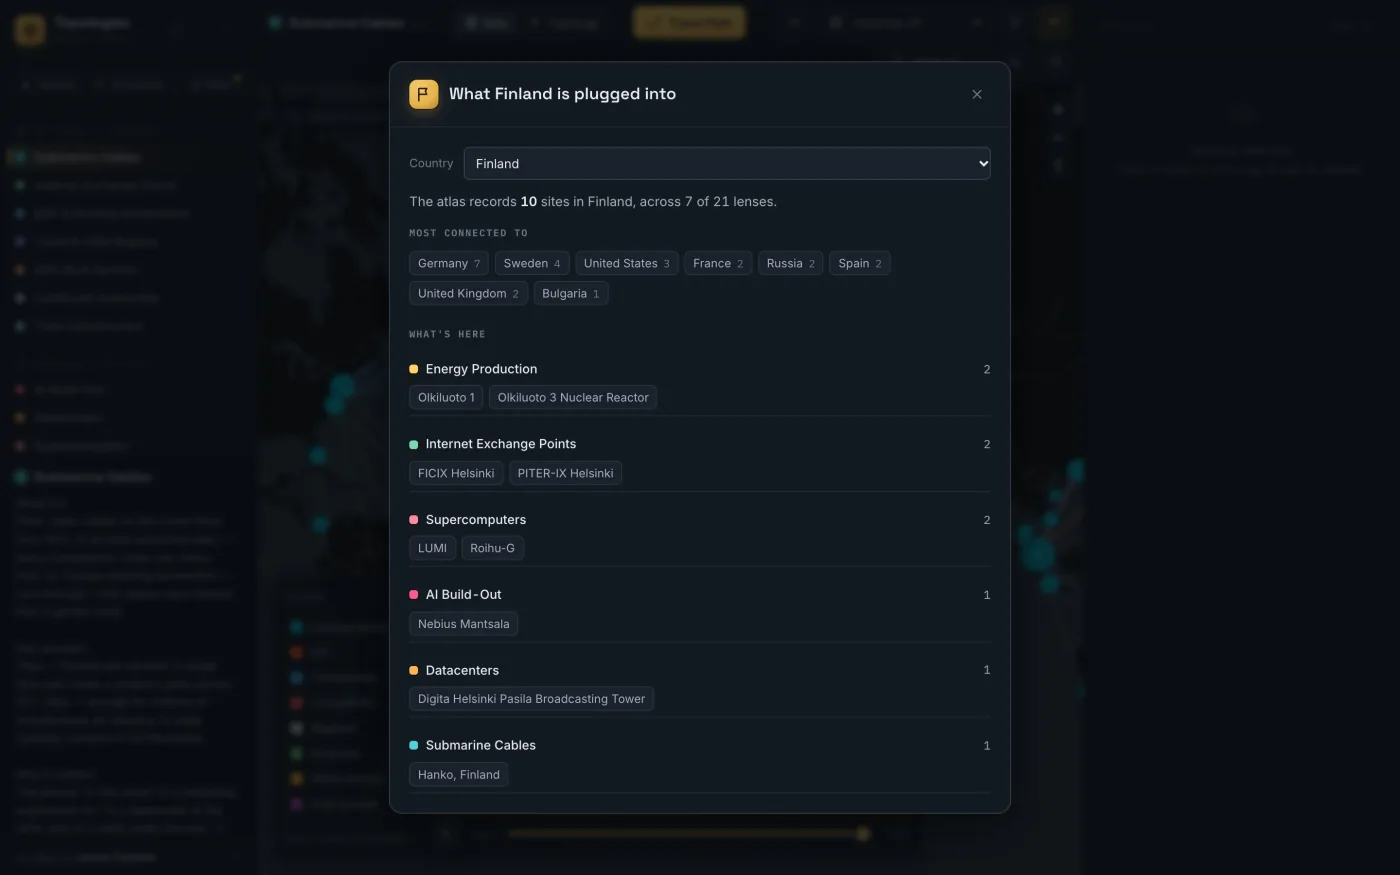
Country pages. Pick a country and see what the atlas records there and what it's most connected to. Finland has 10 sites across 7 lenses, and connects most to Germany and Sweden.
 (opens full size)
A What Changed feed. It's generated by diffing the data against the previous version, so every line is something that actually changed, not something I remembered to write down.
 (opens full size)
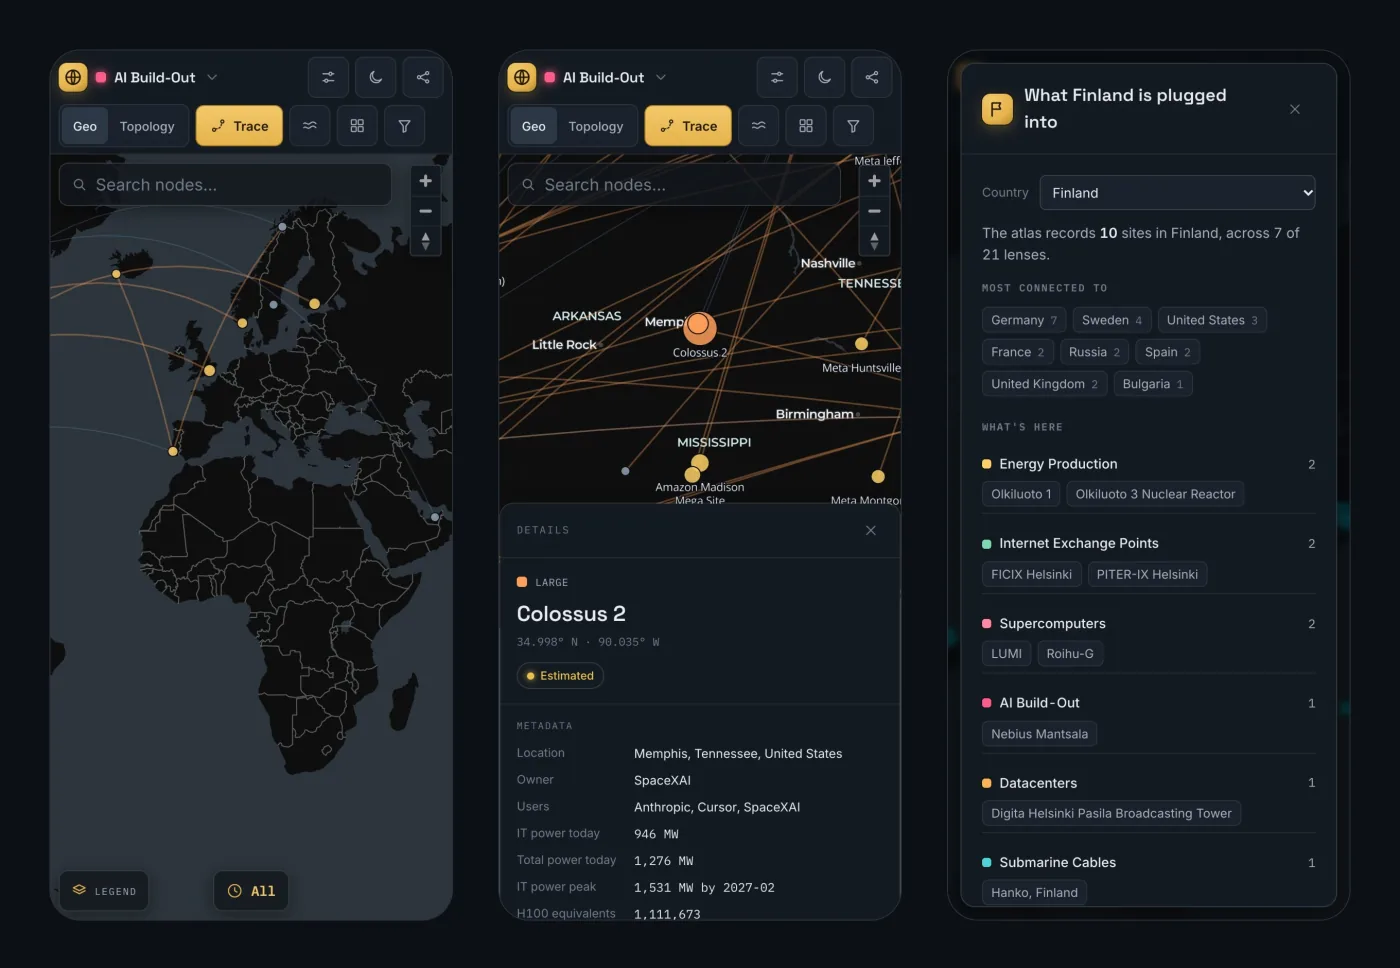
Phones and tablets. The map takes the whole screen, the panels become bottom sheets, and the camera moves the selection clear of the sheet.
 (opens full size)
Every lens, story and country also has its own address and page title now, so you can link straight to the narrow seas and search engines can find it.
A refresh I still have to approve
The bigger change is one you can't see. A GitHub Action now runs every importer on the first of each month, validates the result, runs the tests, builds the site and opens a pull request. Nothing goes live until I merge it.
I wanted that last step on purpose, because sources change in ways a script can't judge. A run that would remove more than a quarter of a source's records fails outright, since that usually means the source changed rather than the world. A record that disappears is kept and marked as removed, not deleted. A supercomputer or exchange with no citable location gets skipped and listed for me to look at, never guessed.
Not everything can refresh. Supercomputers, internet exchanges, data centers, AI sites and ground stations come from live sources. DNS roots, chip bottlenecks and several others are curated by hand, and stay as they are until I edit them.
What the first refresh found
Pulling everything forward at once showed how much had quietly gone wrong:
- Pins in the wrong place. Thirteen data center pins sat far from the place their own record named, by up to 912 km. The Dalles was sitting at Mountain View.
- The wrong name. An exchange labelled JINX in Jakarta was really IIX-Jakarta. PeeringDB's JINX is in Johannesburg.
- Two answers at once. The Neurath power station claimed both 4.4 GW and 2,068 MW, because a source had filled in a hand-curated record. Dinorwig was listed twice in the source itself, and 37 rows in all turned out to be second pins for plants already on the map.
- Real sites hidden. Eight facilities had been dropped as duplicates for sitting within a kilometre of a city-level cloud region pin. The largest was Equinix DC1-DC15 in Ashburn, with 525 networks.
- Sentences that had expired. Beyond El Capitan, the text had Santos Dumont as South America's most powerful machine and Lengau as Africa's fastest. Neither still is.
It's the same lesson as LUMI being pinned in Oulu, which I wrote about last time. None of this shows up until something makes you look.
Three bugs worth keeping
Keeping all this running also turned up bugs of my own. None of them crashed anything, and in all three the build passed.
Hong Kong SAR China. The first refresh on GitHub wanted to rename five internet exchanges from “Hong Kong” to “Hong Kong SAR China”, which would have created a second Hong Kong page. Country names came from JavaScript's Intl.DisplayNames, and its answers depend on the machine. The same code gave a different name on my Mac than on GitHub's runner, and it's also why “Türkiye” sat next to “Turkey”. Country names now come from a fixed list of 250.
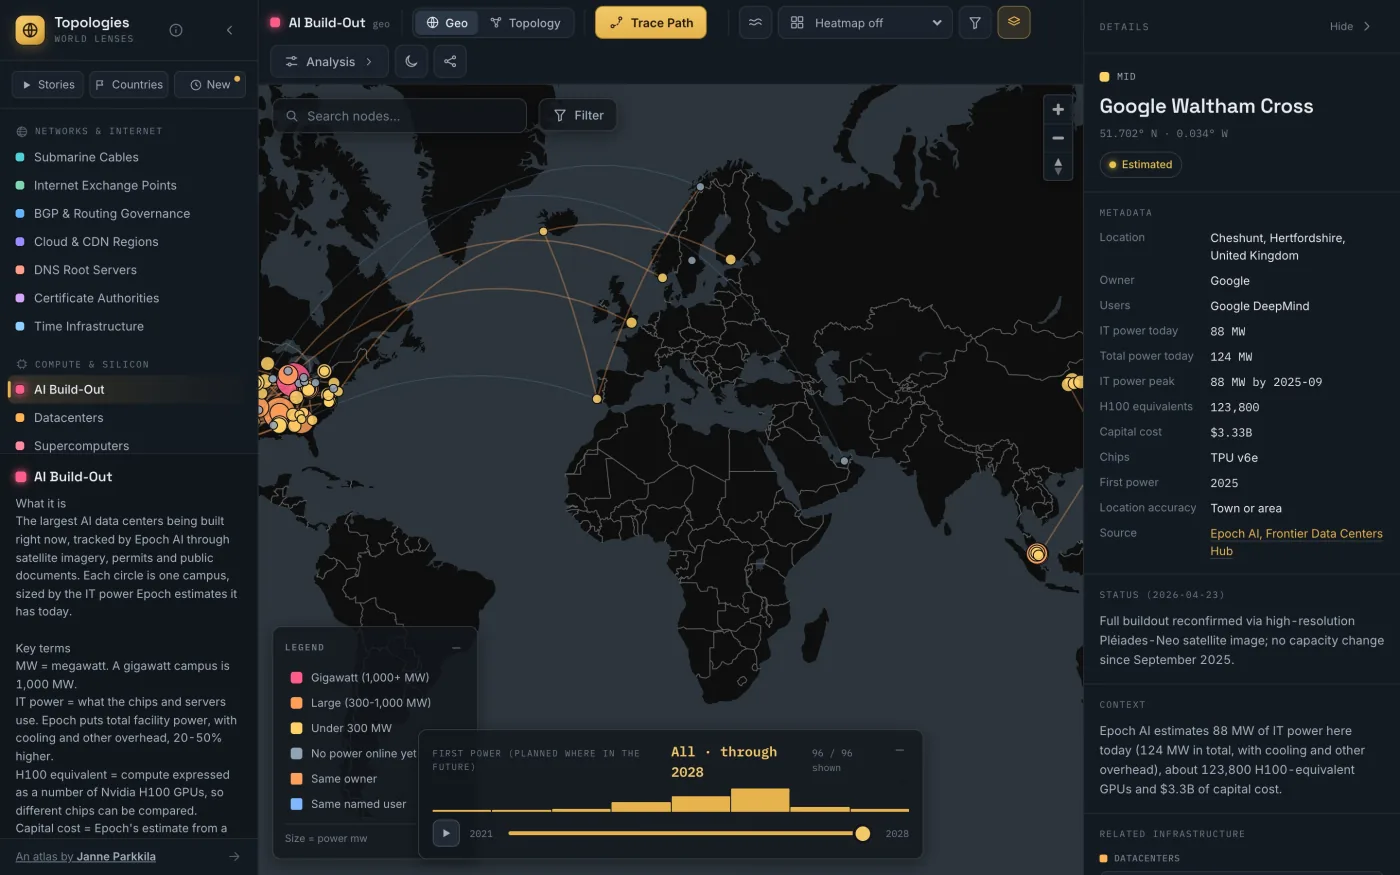
88 MW, or 124? A site's text read “88 MW of power here today. Its timeline reaches 124 MW by 2025-09.” That date had already passed. Epoch publishes two measures: IT power, which is what the chips and servers use, and total facility power, which adds cooling and other overhead. My importer compared one with the other, so a finished building looked like it was still growing. It also overstated real growth: Colossus 2's “2,065 MW” target is 1,531 MW in IT power terms. Each site now shows both figures, labelled.
 (opens full size)
The map that stopped loading. After a routine deploy, the map failed on 9 of 12 fresh page loads. Cloudflare's Stockholm location had stored an HTML page under the address of the map's code, with a one-year cache lifetime. Two sensible settings had combined to do it. The site answers any missing file with its main page, which single-page apps need. Built files also had a long cache rule, which applied to that answer too. So a request that reached a location before a new file did could break the map there for a year. The trigger may well have been my own check, which ran about five seconds after the deploy finished.
The fix removes the cache rule, moves the built files to a new path, and reloads the page once if the map's code fails to load. A later deploy, checked within seconds, stayed clean: 12 of 12.
Knowing whether anyone is looking
Until now I had no idea if anyone used this. There's now Cloudflare Web Analytics for visits, plus a small endpoint that records which lens or story an action was about and the country Cloudflare reports. It uses no cookies and doesn't read IP addresses. It won't tell me much about any one person, which is the point, but it will show me which lenses are worth more work.
How it got done
Most of this was done by directing Claude Code, the same way I built my idle RPG. That covered the dependency upgrades (React 19.3, MapLibre 6, Vite 8, TypeScript 6), the importers, the new features and the fixes. I decided what to build and approved every merge.
What made the difference was checking the running site rather than trusting a green build. The Hong Kong rename showed up by comparing the refresh's data record by record. The cache bug showed up by loading the live map repeatedly right after a deploy. Both had passed every automated check.
What's still not right
An honest atlas should say so:
- Seven of the TOP500 top 100 aren't on the map, because TOP500 gives no town for them and I won't guess.
- The power plants come from WRI's Global Power Plant Database, which hasn't had a new version in years. Airport routes lean on OpenFlights, which rarely changes either.
- The hand-curated lenses are only as current as my last edit.
- Everything in the AI Build-Out is an estimate, and marked as one.
Of the 3,811 live records, 3,267 are marked verified and 544 estimated. That's a number I'd like to keep honest more than I'd like to keep it high.
Map screenshots: basemap © CARTO, map data © OpenStreetMap contributors.