Topologies
An interactive atlas of global infrastructure across 21 lenses, from submarine cables to chip fabs to AI data centers, with guided stories, country pages, path tracing and what-if simulation.

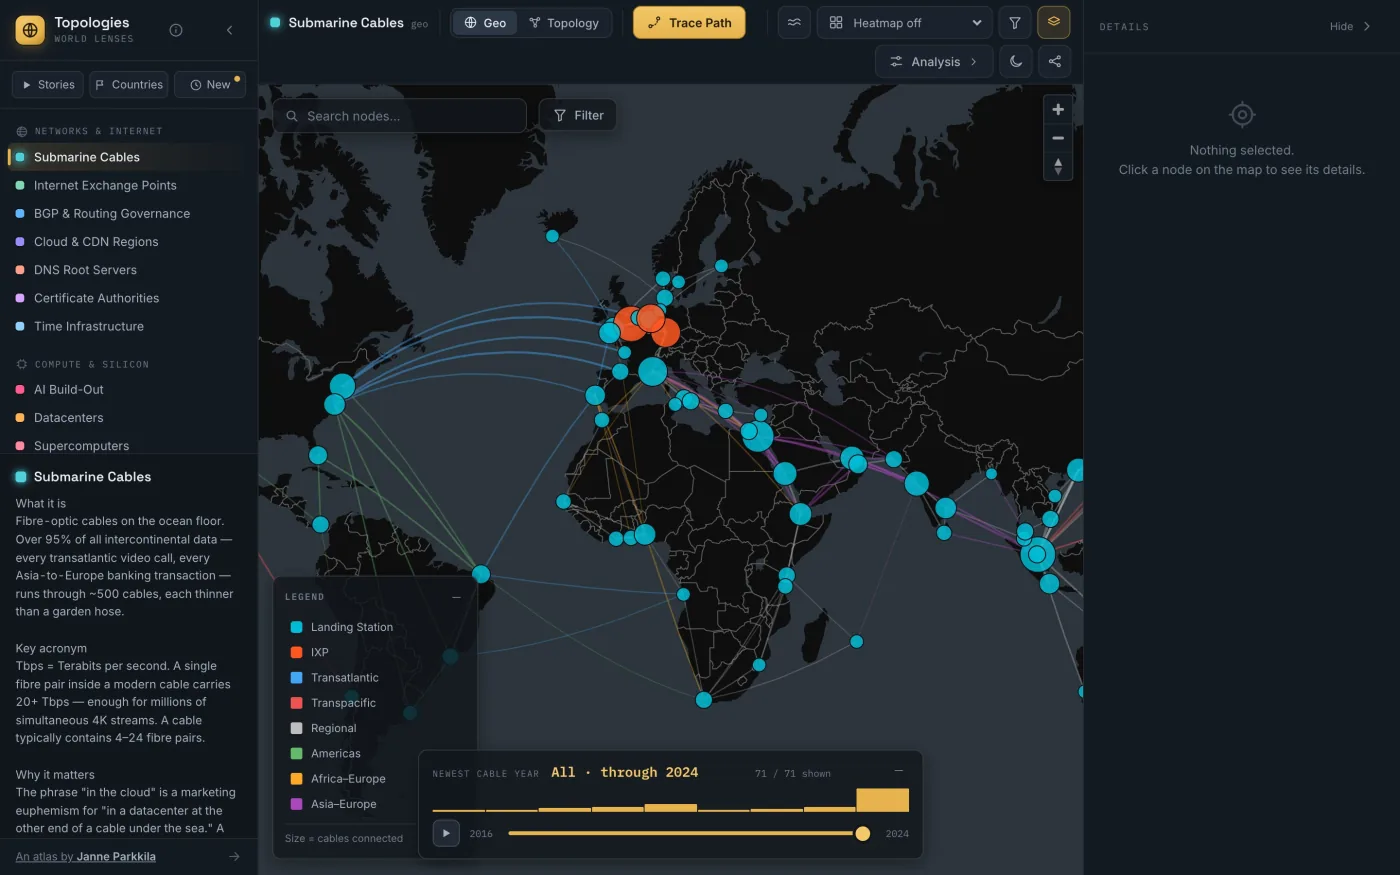
Topologies is an interactive atlas of the hidden infrastructure that runs the modern world. Pick one of 21 lenses, such as submarine cables, internet exchanges, BGP routing, AI data centers, chip fabs, power plants, critical minerals, shipping lanes or satellites, and see it drawn on a world map or as a force-directed network. Click anything for its data sheet, trace a path between two points, and follow how one layer depends on the next.
Explore it live → worldlenses.janneparkkila.com
 (opens full size)
Why I built it
What looks like a borderless global internet is really a stack of small-N systems: 13 logical DNS roots, a handful of chip fabs, a short list of atomic clocks that define what time it is. Switching lenses makes that concentration visible, and shows how a failure, sanction or conflict at one layer ripples through the rest. I wanted a single tool that makes those dependencies tangible for students, researchers and the merely curious.
Start here
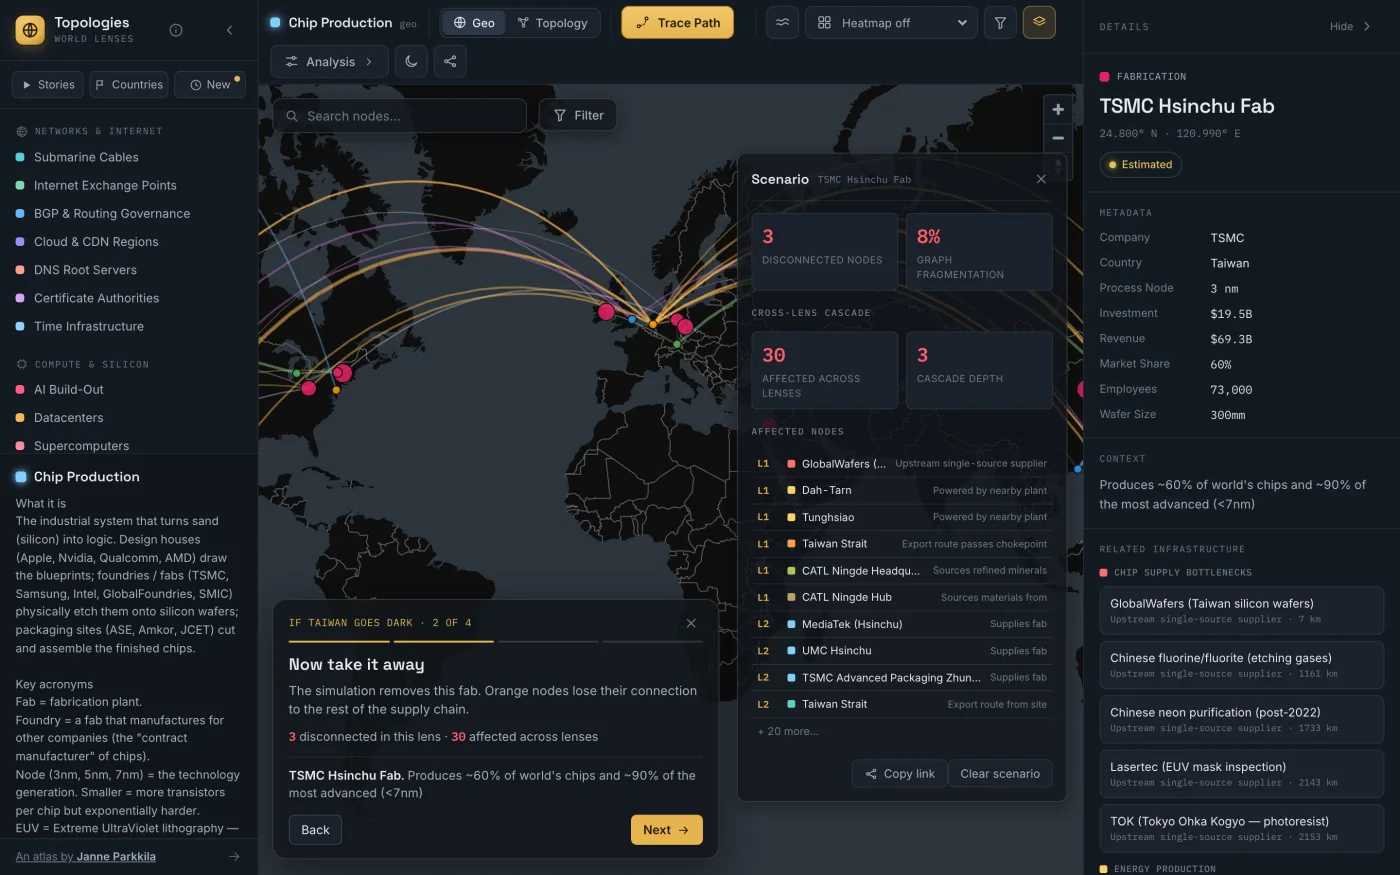
You don't need to know what to look for. Five guided stories walk across the lenses in a few steps each:
- If Taiwan goes dark: one island, one company, and the chips inside almost everything
- One town in the Netherlands: the machines that make advanced chips come from a single place
- The narrow seas: a few straits carry the oil, the containers and the internet
- The internet's hidden roots: names, trust and time rest on a surprisingly small cast
- The AI build-out: campuses the size of power stations, going up right now
 (opens full size)
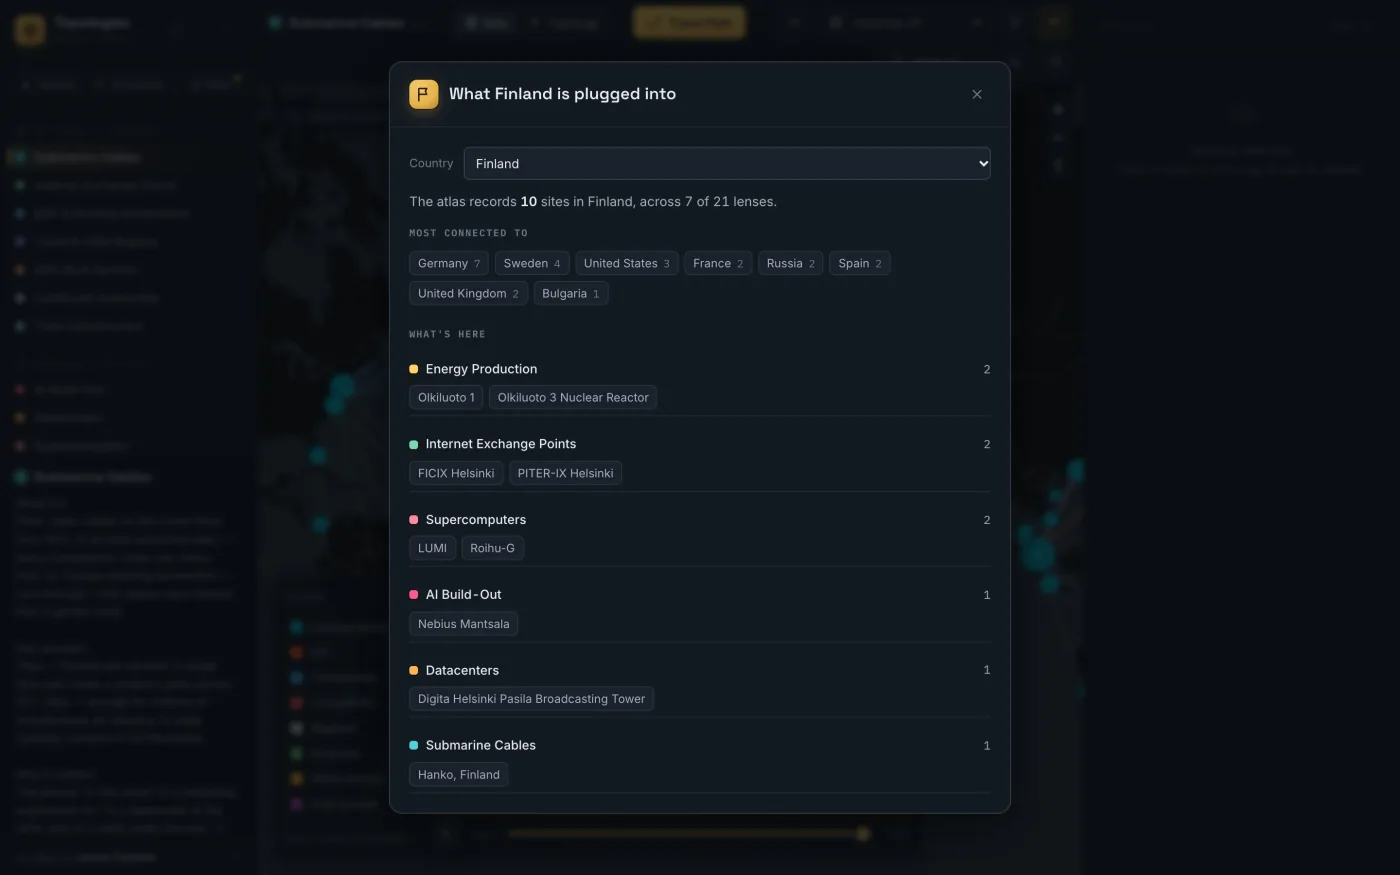
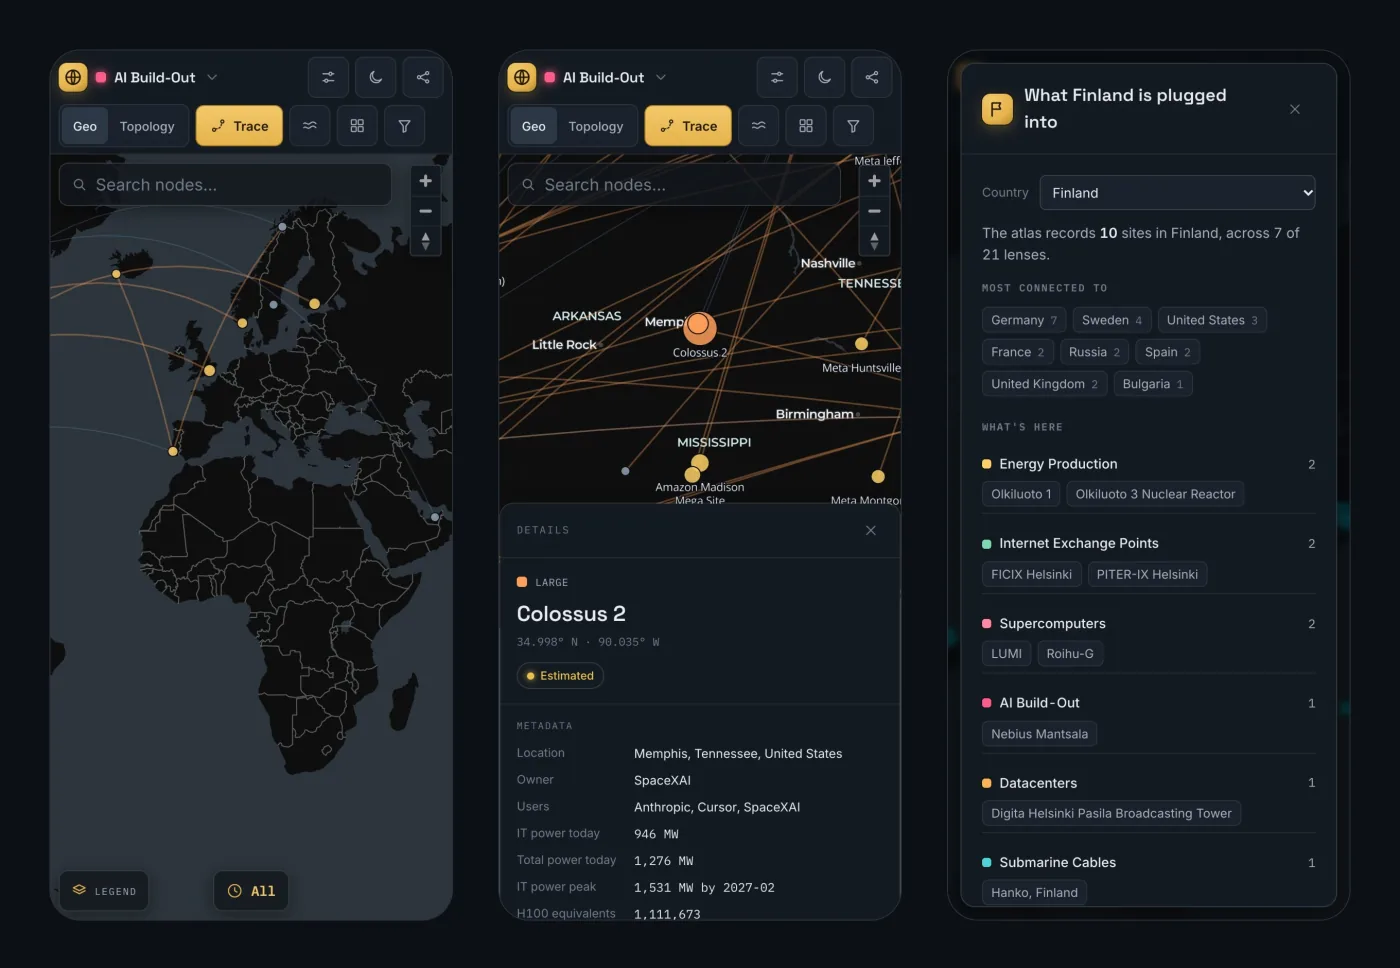
Or start from a place. Every country has a page showing what the atlas records there and what it connects to, like Finland or the Netherlands.
 (opens full size)
What it does
- Two views, one language. Every lens renders on a MapLibre world map and as a d3-force network.
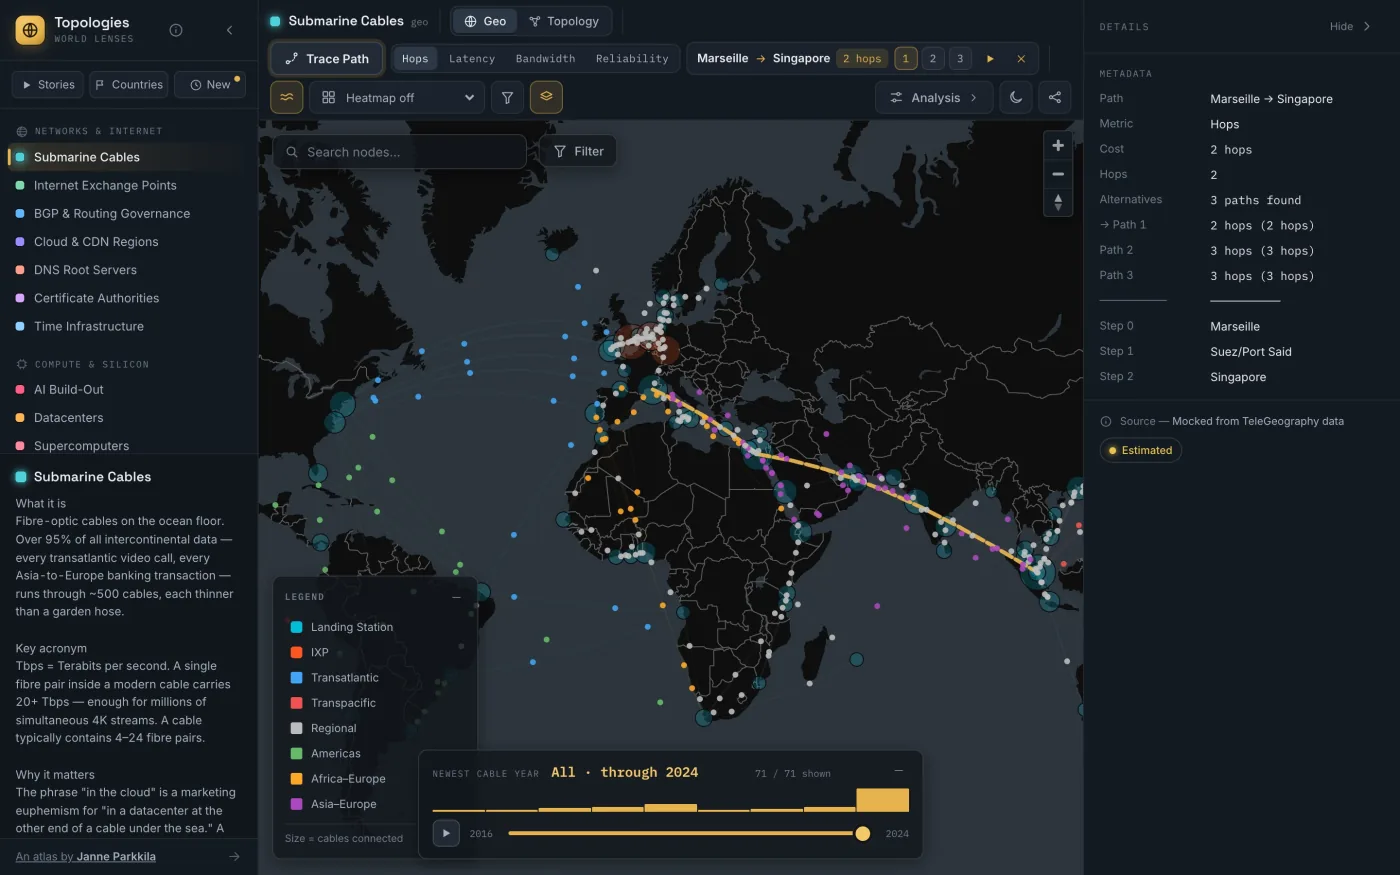
- Path tracing. Find the best route between two nodes with Dijkstra, plus alternatives from Yen's k-shortest paths. Each lens offers the metrics its data supports, such as hops, latency, bandwidth, reliability, distance or throughput.
- Cross-lens dependencies. Click a datacenter and see the power plants, exchanges and cables around it, then follow the chain.
- What-if simulation. Remove a node and see what disconnects in that lens and what cascades across the others.
- Time, filters, stats, heatmaps, compare. Scrub a lens through the years, filter by any field, see distributions, shade the map by a metric, or put two lenses side by side.
- Works on a phone. The map takes the whole screen, and the panels become bottom sheets.
- Dark and light. A brass-on-graphite “cartographic instrument” theme, with a daylight variant.
 (opens full size)
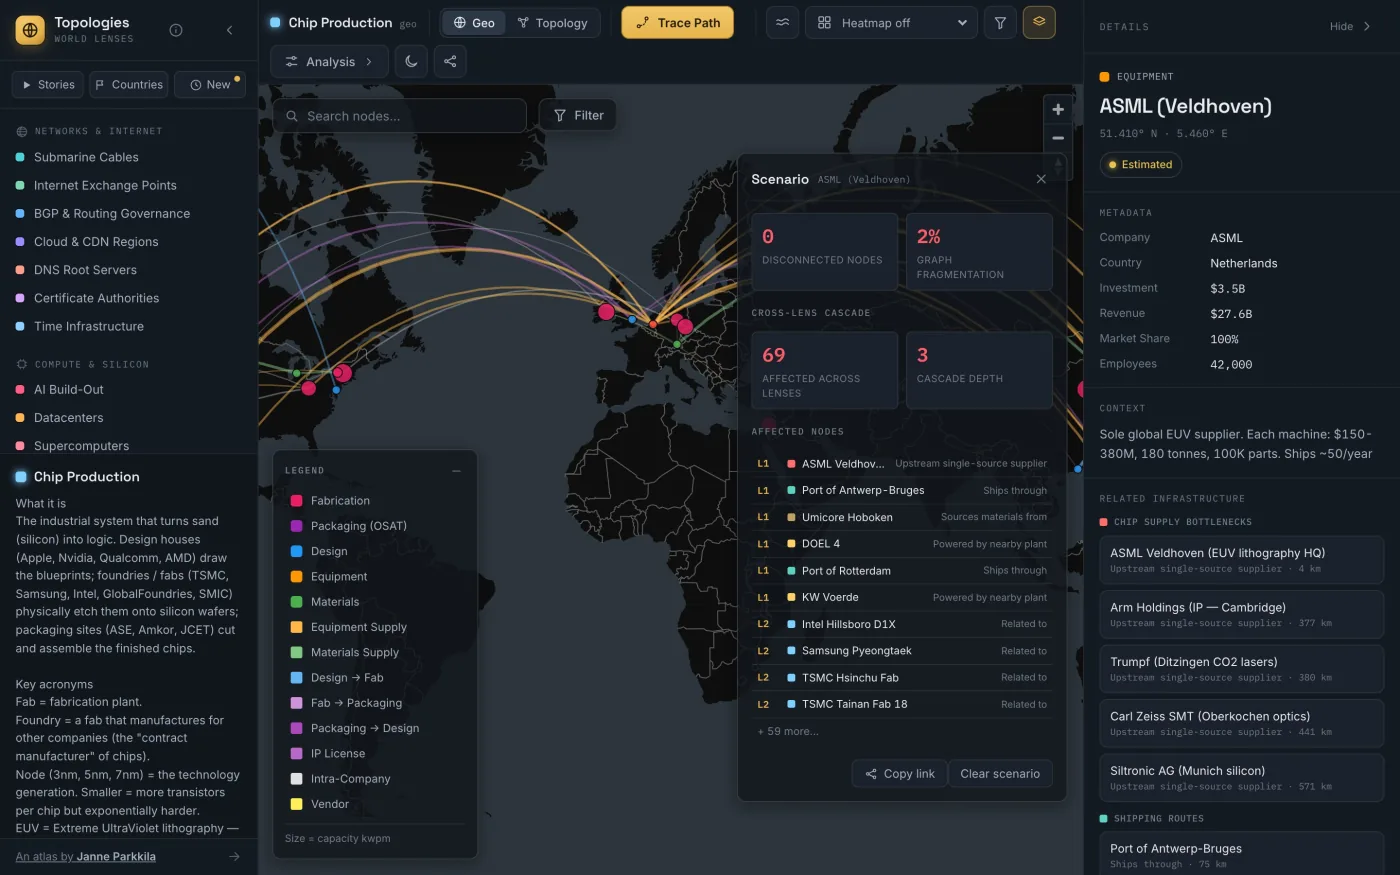 (opens full size)
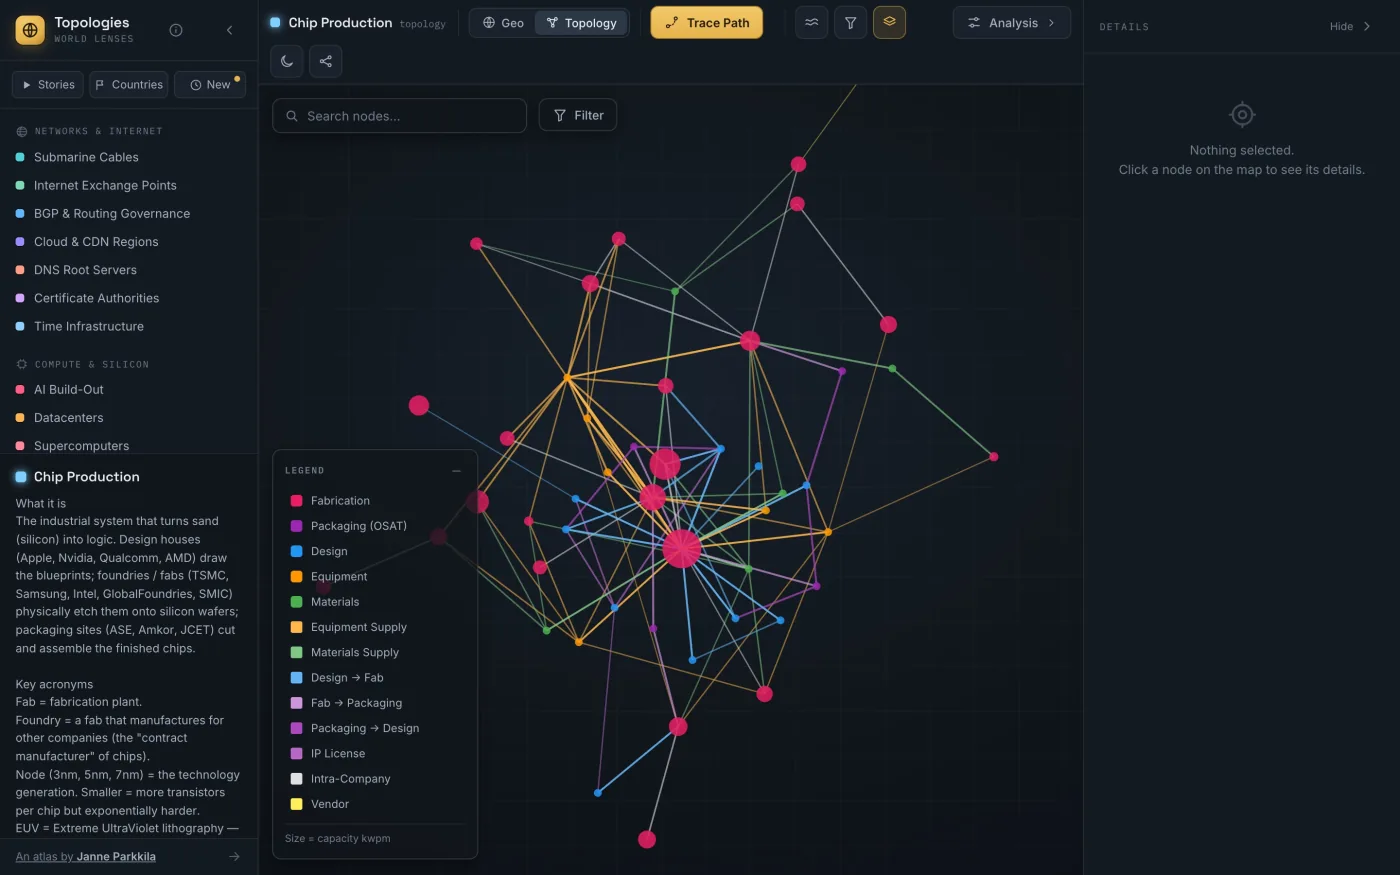 (opens full size)
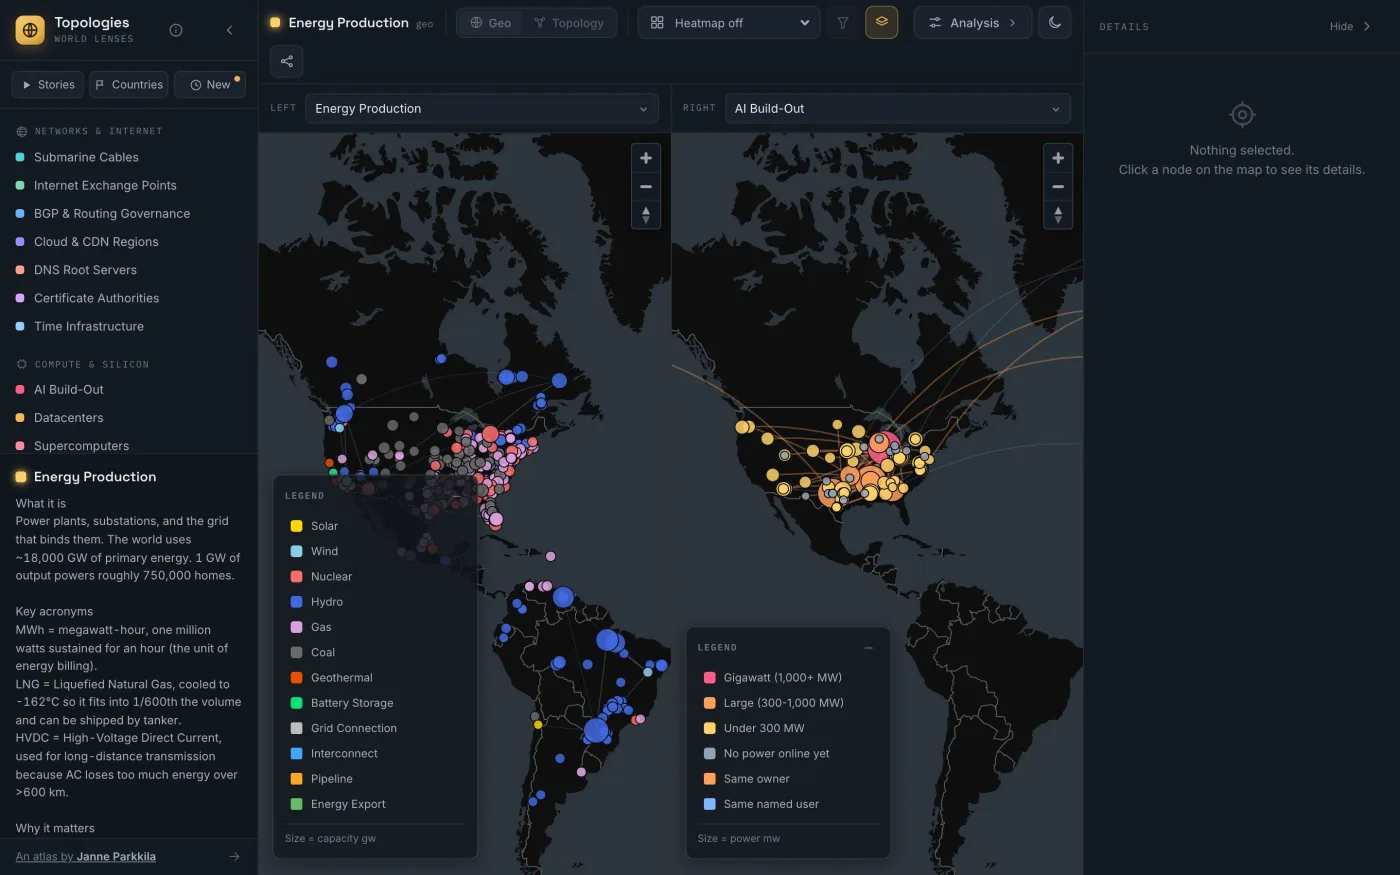 (opens full size)
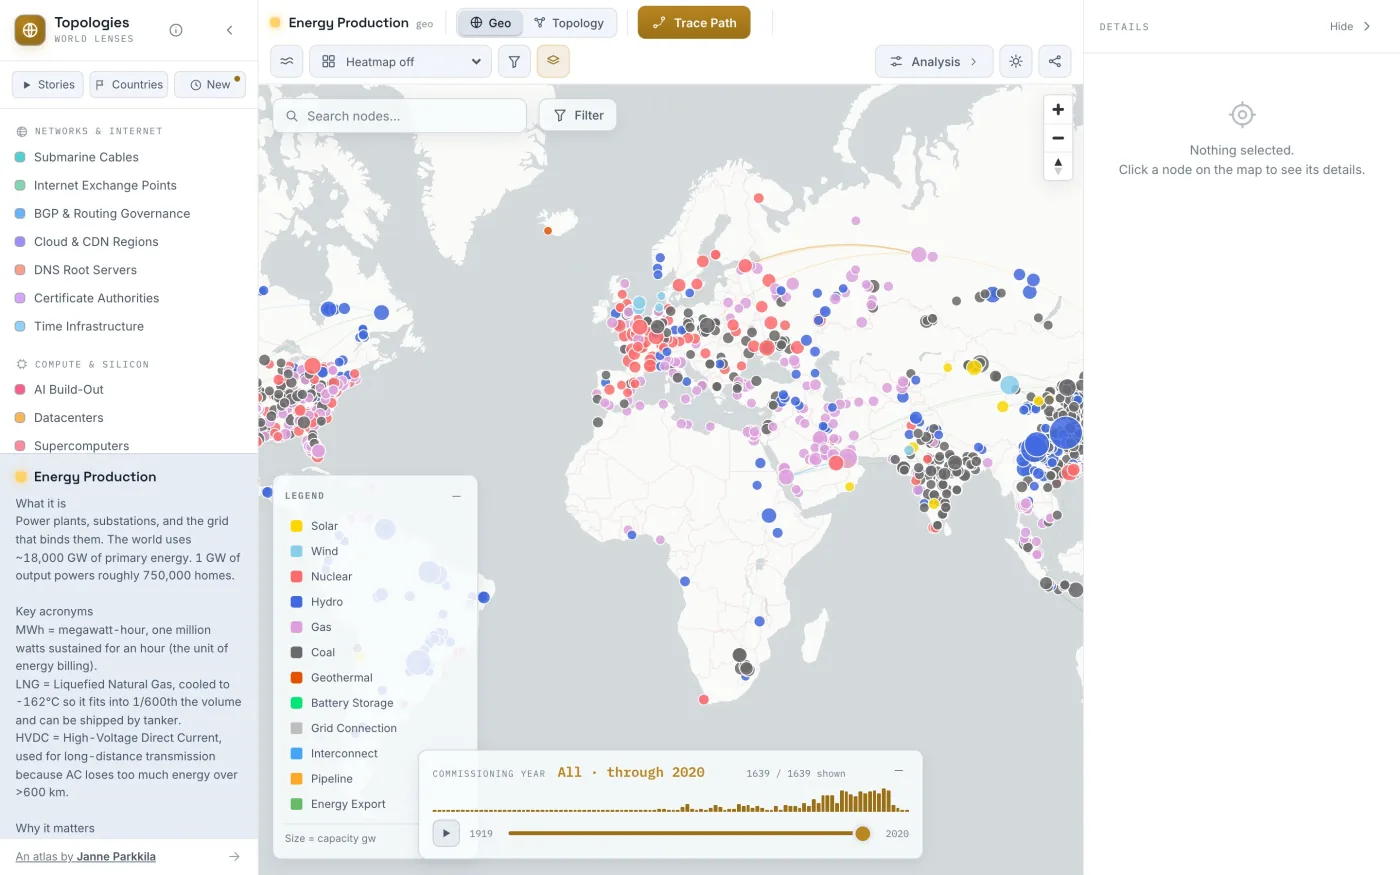 (opens full size)
 (opens full size)
The AI Build-Out
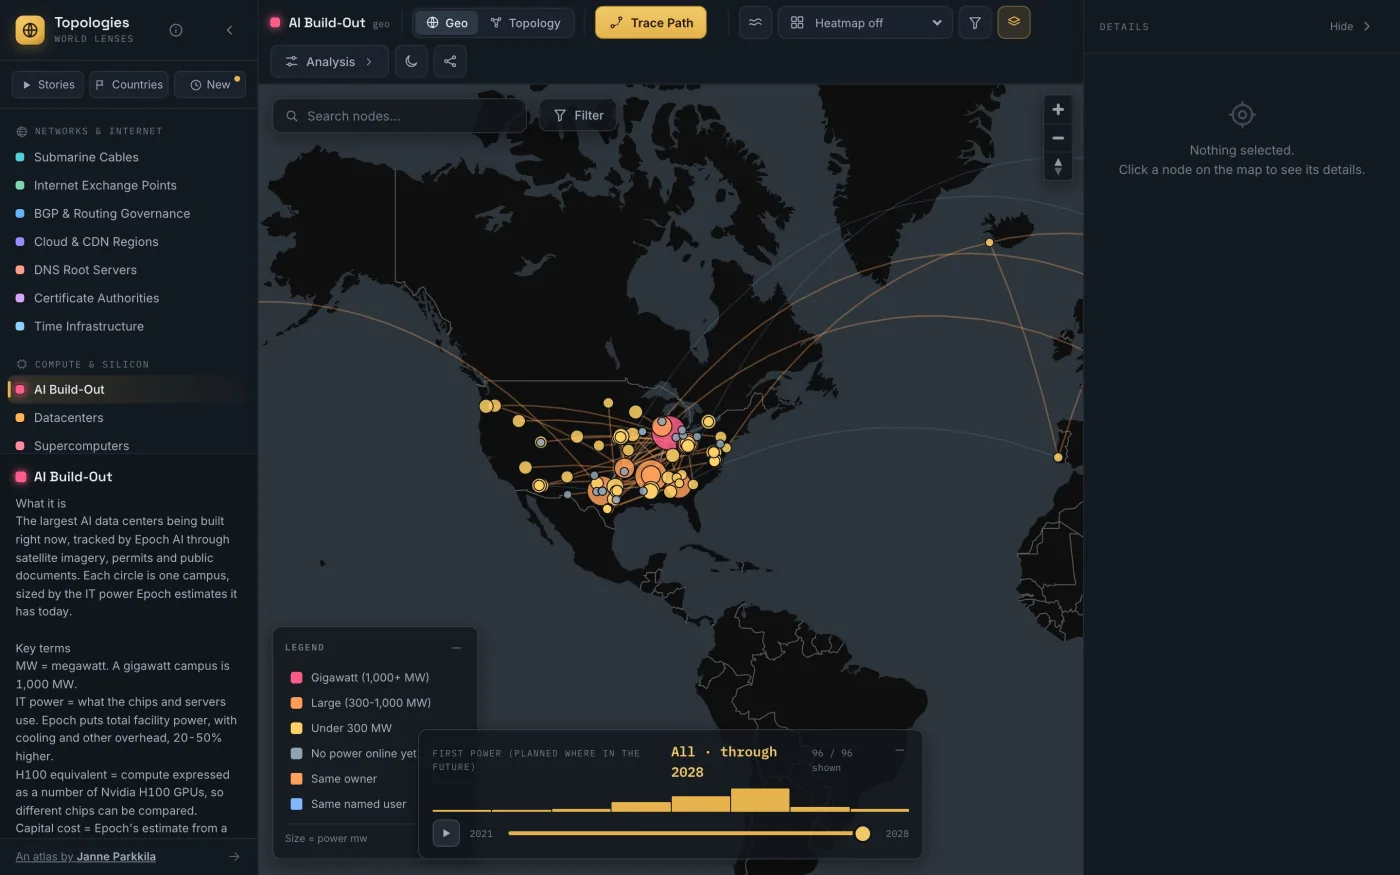
The newest lens tracks 96 of the largest AI data centers, using estimates from Epoch AI built from satellite imagery, permits and public documents. 76 have power online and 20 don't yet. The data sheets show IT power, the total with cooling and other overhead, estimated compute and capital cost, and where each site's timeline is heading.
 (opens full size)
Honest data
Every node and figure carries a confidence level: verified (public records or operator data), estimated (derived or interpolated) or mocked (a structural placeholder, never a fake statistic). Of the 3,811 live nodes across the lenses, 3,267 are verified and 544 are estimated.
Data comes from public sources, including PeeringDB, TOP500, SatNOGS, OurAirports, OpenFlights, Epoch AI, the WRI Global Power Plant Database, USGS, the IEA, root-servers.org and TeleGeography's public cable map. Each stays under its own terms, and all are credited on the in-app Licenses & Disclaimer page.
How it stays current
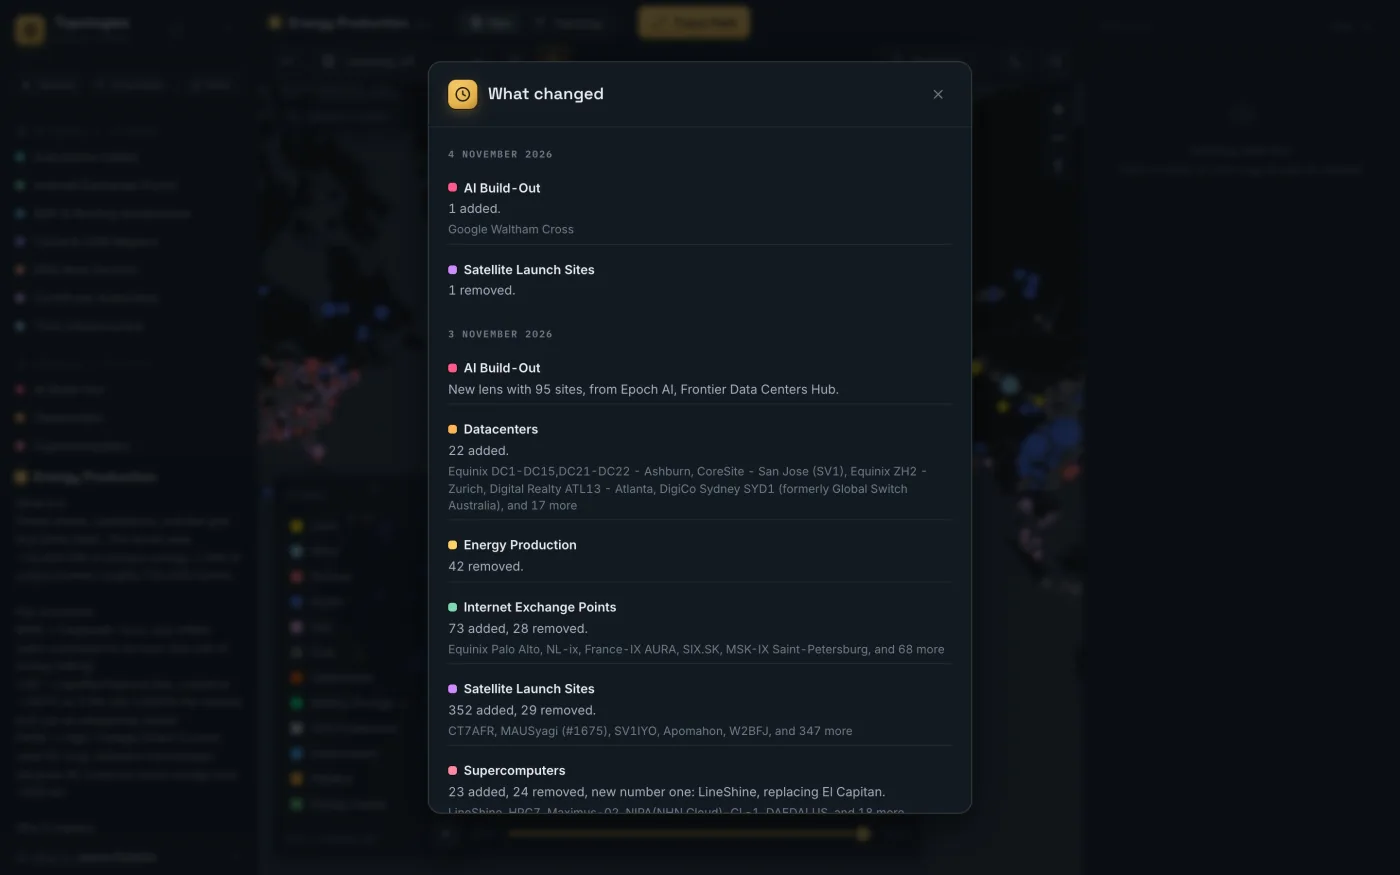
A GitHub Action re-runs the importers every month, validates the result, and opens a pull request. Nothing goes live until I've merged it, and a run that would remove more than a quarter of a source's records fails instead of proposing it. The app's What Changed feed is generated by diffing the data, so every line reflects a real change.
 (opens full size)
Not everything refreshes. Supercomputers, internet exchanges, data centers, AI sites and ground stations come from live sources. Lenses like DNS roots and chip bottlenecks are curated by hand, and change when I edit them.
Read about what the first refreshes turned up →
Built with
React 19 · TypeScript · MapLibre GL · d3-force · Vite · Bun. Static JSON with prerendered pages for every lens, story and country, deployed to Cloudflare Pages through GitHub Actions, with cookie-free analytics from Cloudflare.
Design and build: Janne Parkkila. Free to use in teaching, demos and research; attribution appreciated. Map screenshots: basemap © CARTO, map data © OpenStreetMap contributors.